The Global Natural Capital Index 2024
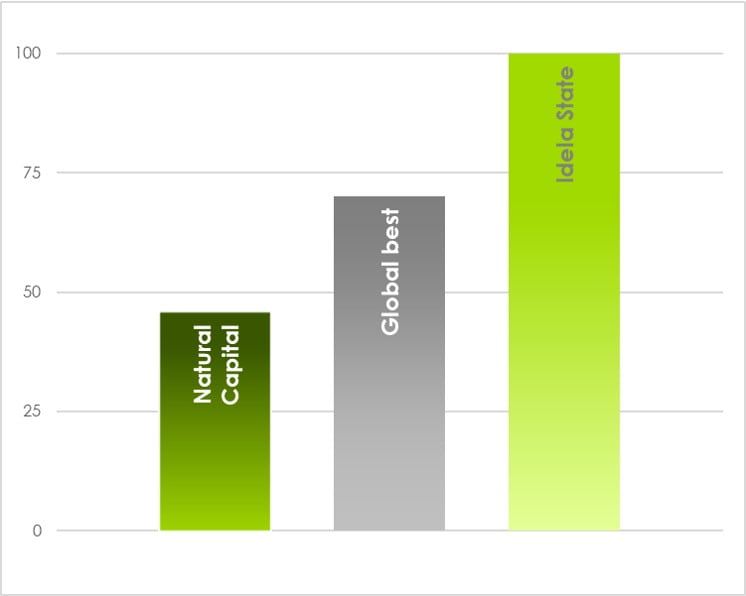
The Natural Capital reflects “the given” natural environment of a country, and the state of its health/decline of that Natural Capital, measured through 38 quantitative indicators covering all aspects of natural resources.
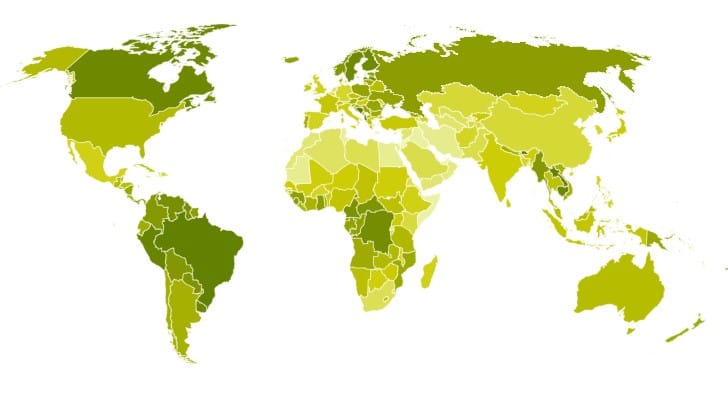
High-ranking countries are characterised by abundant water availability, the source of a rich biodiversity. Many of the highest scoring countries are located in tropical areas. While some of these countries currently may lack social, intellectual and governance capital, their Natural Capital would allow them to develop sustainable competitive economies over time. A certain correlation with the level of human activities and population density can also be observed: large countries with a comparably small population density and rich biodiversity tend to score higher.
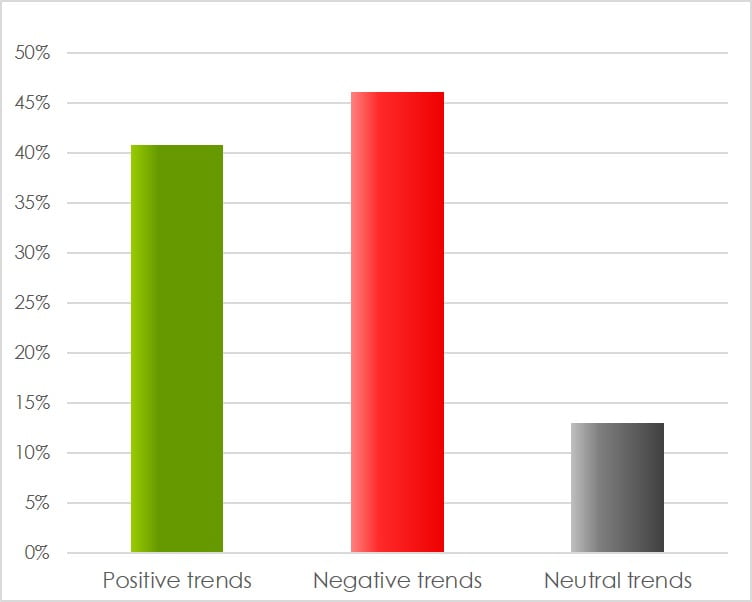
Natural Capital Key Indicators


The Natural Capital Index 2024 – key take-aways:
- The 2024 Natural Capital Index is led by Bhutan, with Bosnia, Brazil, and Laos following closely. Countries in South America, benefiting from their extensive biodiversity, consistently achieve high scores in natural capital.
- Scandinavian nations rank among the top 30 globally due to their low population density, high forest coverage, and abundant freshwater resources. Similarly, several African countries within the tropical belt, including the Democratic Republic of the Congo, the Republic of the Congo, Gabon, and Cameroon, exhibit relatively high rankings, reflecting their significant natural resource endowments.
- In contrast, the world’s two most populous nations, India (ranked 107th) and China (ranked 141st), face substantial challenges. Factors such as arid climates, high population densities, and significant levels of natural resource depletion threaten these countries’ long-term capacity to sustain their populations.
- Additionally, other highly populous nations in less developed regions, including Pakistan, Egypt, and Iran, perform poorly on the Natural Capital Index. These results raise concerns regarding their ability to support growing populations, particularly in the context of escalating climate change impacts and environmental disruption.
Natural Capital World Map 2024


