Intellectual Capital Index
The Intellectual Capital Index
Quality and availability of education in the past are an indication for today’s R&D and innovation capabilities, and today’s education performance reflect future innovation capabilities. Strength and depth of R&D activities is the basis for the development of value-added technologies and services. Educational performance indicators are therefore highly important to estimate the ability for sustained innovation and competitiveness

Intellectual capital: sustaining the innovation drive
Innovation – which in turn is the result of education – allows countries to compete in the globalised markets.
In order to create and sustain wealth, jobs and income for the population are required. Providing jobs requires producing goods and providing services that people or businesses, domestically or abroad, are willing to buy. This in turn requires products and services to be competitive in the global market in terms of quality and price. To maximise the domestic benefits, the value chain is ideally covered within the boundaries of a national economy – the largest share of adding value is contained in processing raw materials and/or parts to finished products.
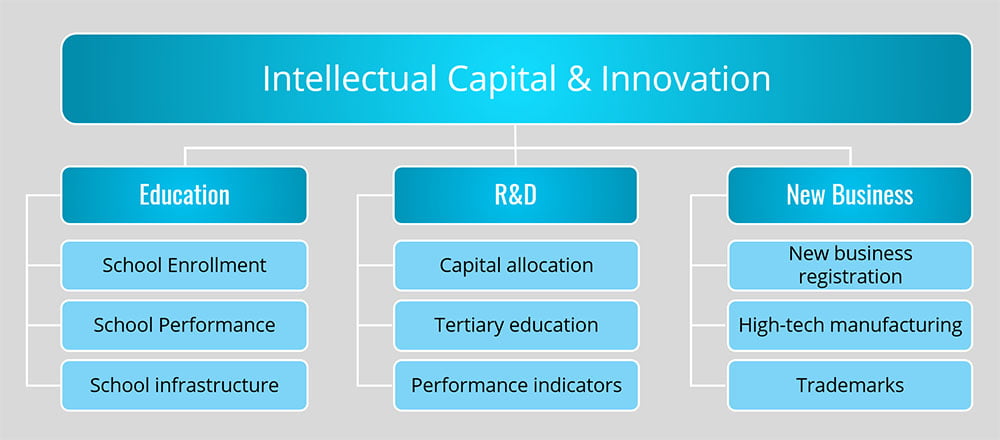
The Intellectual Capital Index is based indicators that measure the extend of the following clusters

State of the World – Intellectual Capital
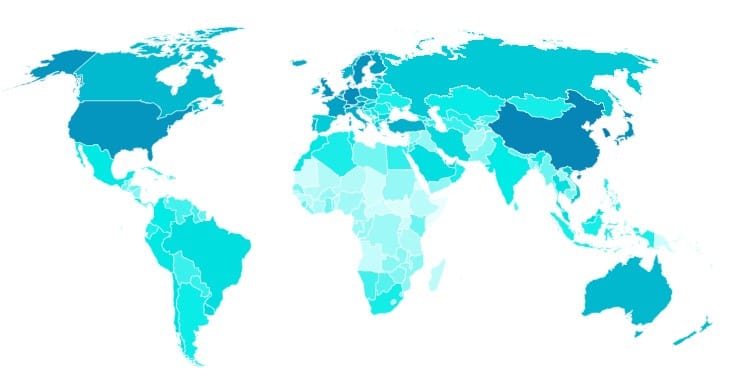
The global average in the Intellectual Capital Index is 39 – the gap to a perfect World 61. The Difference between low-performing countries (lowest: 11) and the highest score (78) is striking, and reflects – even stronger than a GNI comparison – the North-South gap. A high score in the Intellectual Capital Index is the basis for future innovation and therefore economic success. Unfortunately, poor countries also score poor in Intellectual Capital, raising the fear that large parts of Africa will remain trapped in poverty.
On a positive note, nearly 60% of all indicators show positive development globally. However, most of the improvements seem to be originating in Europe, Far & South-East Asia, and the Americas (excluding Central America).
Countries with a high score in this ranking are more likely than others to develop (or sustain) successful economies through research and know-ledge driven industries, i.e. high-value added industries, and therefore achieve higher growth rates.
Intellectual Capital Index Ranking 2024
- North-East Asian countries (South Korea, China, Japan, Singapore) lead the intellectual capital sub-index of the GSCI, reflecting their dominance in technology advancement.
- South Korea retains the top position in innovation, significantly ahead of other nations.
- China ranks second, highlighting its rapid technological progress and the impact of state-led investments in education.
- Germany (4th), the UK (6th), and the US (8th) also perform strongly.
- Scandinavian nations and Israel rank within the top 20.
- Among emerging economies, Brazil is ranked 49th, India 62nd, and Nigeria 169th.
- On the African continent, Morocco (57th), Tunisia (68th), and South Africa (76th) are the highest-ranked nations.
- Most African countries, however, remain underperforming in intellectual capital, raising concerns about persistent poverty traps.
2024 Intellectual Capital Ranking
| Country | Rank | Score |
|---|---|---|
| Korea | 1 | 77.86 |
| China | 2 | 75.00 |
| Germany | 3 | 73.69 |
| Switzerland | 4 | 72.16 |
| Japan | 5 | 72.05 |
| United Kingdom | 6 | 71.89 |
| Sweden | 7 | 71.53 |
| United States of America | 8 | 70.14 |
| Singapore | 9 | 69.68 |
| Finland | 10 | 67.53 |
| Denmark | 11 | 67.44 |
| Netherlands | 12 | 67.00 |
| France | 13 | 66.75 |
| Israel | 14 | 66.68 |
| Liechtenstein | 15 | 66.52 |
| Belgium | 16 | 66.38 |
| Austria | 17 | 66.23 |
| Luxembourg | 18 | 64.49 |
| Iceland | 19 | 64.46 |
| Estonia | 20 | 62.94 |
| Italy | 21 | 62.40 |
| Norway | 22 | 62.12 |
| Turkey | 23 | 61.97 |
| Slovenia | 24 | 61.77 |
| Poland | 25 | 60.57 |
| Portugal | 26 | 60.45 |
| Czechia | 27 | 60.25 |
| Australia | 28 | 59.93 |
| Canada | 29 | 59.26 |
| Ireland | 30 | 58.83 |
| Malta | 31 | 58.24 |
| New Zealand | 32 | 58.00 |
| Cyprus | 33 | 55.07 |
| Viet Nam | 34 | 54.45 |
| Croatia | 35 | 54.35 |
| Russian Federation | 36 | 54.31 |
| Lithuania | 37 | 54.22 |
| Greece | 38 | 53.90 |
| Spain | 39 | 53.88 |
| Slovakia | 40 | 52.87 |
| Hungary | 41 | 52.61 |
| Latvia | 42 | 51.80 |
| Bulgaria | 43 | 50.65 |
| United Arab Emirates | 44 | 50.07 |
| Uruguay | 45 | 49.52 |
| Iran | 46 | 49.28 |
| Malaysia | 47 | 48.89 |
| Tuvalu | 48 | 48.69 |
| Brazil | 49 | 48.34 |
| Barbados | 50 | 47.90 |
| Saudi Arabia | 51 | 47.86 |
| Thailand | 52 | 47.73 |
| Chile | 53 | 47.63 |
| Andorra | 54 | 46.88 |
| Palestine, State of | 55 | 45.99 |
| Peru | 56 | 45.45 |
| Morocco | 57 | 45.44 |
| Serbia | 58 | 45.39 |
| Saint Vincent and the Grenadines | 59 | 45.23 |
| Antigua and Barbuda | 60 | 44.91 |
| Mexico | 61 | 44.89 |
| India | 62 | 44.59 |
| Colombia | 63 | 44.55 |
| Georgia | 64 | 44.44 |
| Palau | 65 | 44.42 |
| Moldova | 66 | 44.15 |
| Qatar | 67 | 44.03 |
| Tunisia | 68 | 43.96 |
| Belarus | 69 | 43.81 |
| Costa Rica | 70 | 43.70 |
| Kazakhstan | 71 | 43.49 |
| Kiribati | 72 | 43.24 |
| Argentina | 73 | 42.97 |
| Mauritius | 74 | 42.31 |
| Albania | 75 | 42.11 |
| South Africa | 76 | 41.64 |
| Marshall Islands | 77 | 41.63 |
| Indonesia | 78 | 41.40 |
| Romania | 79 | 41.37 |
| Ukraine | 80 | 41.36 |
| Uzbekistan | 81 | 41.31 |
| North Macedonia | 82 | 41.09 |
| Armenia | 83 | 40.95 |
| Mongolia | 84 | 40.95 |
| Oman | 85 | 40.92 |
| Brunei Darussalam | 86 | 40.72 |
| Algeria | 87 | 40.54 |
| Kosovo | 88 | 40.16 |
| Philippines | 89 | 40.13 |
| Montenegro | 90 | 40.10 |
| Ecuador | 91 | 40.01 |
| Seychelles | 92 | 39.82 |
| Cuba | 93 | 39.80 |
| Azerbaijan | 94 | 39.01 |
| Bosnia and Herzegovina | 95 | 38.88 |
| Fiji | 96 | 38.68 |
| Saint Lucia | 97 | 38.21 |
| Saint Kitts and Nevis | 98 | 38.03 |
| Vanuatu | 99 | 37.69 |
| Egypt | 100 | 37.63 |
| Paraguay | 101 | 36.95 |
| Tonga | 102 | 36.59 |
| Maldives | 103 | 36.45 |
| Guyana | 104 | 36.10 |
| Turkmenistan | 105 | 36.03 |
| Kyrgyzstan | 106 | 35.98 |
| Bolivia | 107 | 35.96 |
| Samoa | 108 | 35.87 |
| Micronesia | 109 | 35.50 |
| Namibia | 110 | 35.11 |
| Venezuela | 111 | 34.96 |
| Jamaica | 112 | 34.91 |
| Jordan | 113 | 34.10 |
| Lebanon | 114 | 33.96 |
| Kuwait | 115 | 33.84 |
| Bahrain | 116 | 33.66 |
| Belize | 117 | 33.47 |
| Dominican Republic | 118 | 32.57 |
| Botswana | 119 | 32.11 |
| Sri Lanka | 120 | 32.00 |
| Solomon Islands | 121 | 31.59 |
| Panama | 122 | 31.29 |
| Tajikistan | 123 | 31.01 |
| Nepal | 124 | 30.90 |
| Timor-Leste | 125 | 30.76 |
| Suriname | 126 | 30.74 |
| Bahamas | 127 | 30.38 |
| Dominica | 128 | 30.30 |
| Sao Tome and Principe | 129 | 30.16 |
| Grenada | 130 | 30.07 |
| Honduras | 131 | 29.58 |
| Sierra Leone | 132 | 29.51 |
| Bhutan | 133 | 29.35 |
| Kenya | 134 | 29.20 |
| Myanmar | 135 | 29.11 |
| Guatemala | 136 | 28.73 |
| Cabo Verde | 137 | 28.30 |
| Ghana | 138 | 28.18 |
| El Salvador | 139 | 28.07 |
| Cambodia | 140 | 27.84 |
| Eswatini | 141 | 27.81 |
| Libya | 142 | 27.56 |
| Rwanda | 143 | 27.01 |
| Trinidad and Tobago | 144 | 27.00 |
| Senegal | 145 | 26.33 |
| Pakistan | 146 | 26.32 |
| Bangladesh | 147 | 26.28 |
| Gambia | 148 | 26.00 |
| Nicaragua | 149 | 25.90 |
| Togo | 150 | 25.68 |
| Zimbabwe | 151 | 25.62 |
| Syrian Arab Republic | 152 | 25.53 |
| Liberia | 153 | 25.51 |
| Zambia | 154 | 24.74 |
| Mozambique | 155 | 24.59 |
| Yemen | 156 | 23.81 |
| Congo | 157 | 23.28 |
| Burkina Faso | 158 | 23.24 |
| Iraq | 159 | 22.91 |
| Comoros | 160 | 22.67 |
| Sudan | 161 | 22.51 |
| Lao | 162 | 22.49 |
| Djibouti | 163 | 22.36 |
| Gabon | 164 | 22.24 |
| Cameroon | 165 | 22.14 |
| Congo DR | 166 | 21.59 |
| Burundi | 167 | 21.50 |
| Lesotho | 168 | 21.15 |
| Nigeria | 169 | 20.98 |
| Malawi | 170 | 20.74 |
| Equatorial Guinea | 171 | 20.62 |
| Afghanistan | 172 | 20.22 |
| Haiti | 173 | 19.61 |
| Côte d'Ivoire | 174 | 19.56 |
| Tanzania | 175 | 19.27 |
| Benin | 176 | 18.89 |
| Mali | 177 | 18.50 |
| Niger | 178 | 18.43 |
| Guinea | 179 | 18.08 |
| Ethiopia | 180 | 17.57 |
| Guinea-Bissau | 181 | 16.97 |
| Madagascar | 182 | 16.88 |
| Angola | 183 | 16.02 |
| Uganda | 184 | 14.99 |
| Central African Republic | 185 | 14.89 |
| Chad | 186 | 14.77 |
| Papua New Guinea | 187 | 14.48 |
| Mauritania | 188 | 14.13 |
| Eritrea | 189 | 13.21 |
| South Sudan | 190 | 12.91 |
| Somalia | 191 | 10.74 |

Download the data: [download id="11713"](XLSX)](https://solability.com/wp-content/uploads/2024/12/GSCI-2024-Cover-1.jpg)
![Sustainable_Competitive Report Achieving Sustainable Competitiveness: policies for more sustainable AND more prosperous societies:[download id="3496"]](https://solability.com/wp-content/uploads/2021/01/Sustainable_Competitive-Report.jpg)