Resource Intensity Index
Resource Intensity & Resource Efficiency
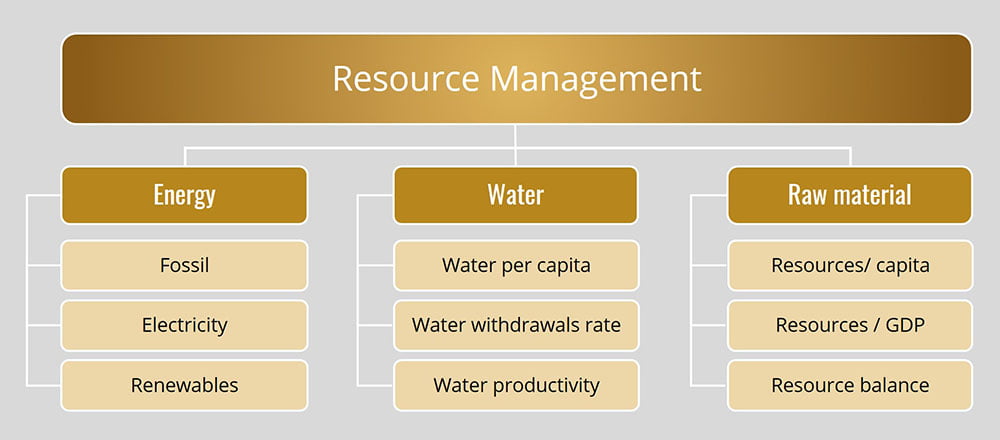
Resource management is the ability to manage available resource (natural capital, human capital, financial capital) efficiently – regardless of whether the capital is scarce or abundant. Whether a country does or does not possess resources within its boundaries (natural and other resources), efficiency in using resources – whether domestic or imported – is a cost factor, affecting the competitiveness and thus wealth of nations. Over-exploitation of existing natural resources also affects the natural capital of the country, i.e. the ability of a country to support its population and economy with the required resources into the future.

The main implications of a high or low score in resource efficiency/intensity is related to stability and sustained economic growth. Should global prices for raw materials and energy rise significantly in the future (as trends and the majority of available research suggests), the countries in the lower ranks will face substantial higher costs and challenges to maintain their growth compared to countries with higher efficiency and intensity scores.
Resource Efficiciency & Intensity: State of the World
The global average in resource intensity is 47, while the highest achieved is 64. Even the best performing countries are a long way from being sustainable competitive, i.e. achieving net-zero in a circular economy.
A majority of 61% of all trends in resouce intensity and eficiency are developping positively, mostly thanks to positive developments in energy efficiency. While further improvments can be expected, we are still far from a truly circular economy.
Key Take-Aways: Resource Intensity Index 2024
The Resource Intensity & Efficiency Index is based on both per-capita measurement (intensity) and measurement against total economic output, per-e.g. water usage per unit of GDP (economic efficiency; resource usage per unit of value generated). The countries with low resource consumption – per capita and per GNI/GDP – generally achieve a higher score in terms of intensity, while industrial economies with modern efficient production processes general achieve a higher score in terms of efficiency. As a result, the Resource Intensity /Efficiency sees both developed and lesser developed nation on the top:
- When considering the Intensity Index (per capita resource consumption), less developed countries tend to perform the best.
- In contrast, the Resource Efficiency Index (resource consumption per unit of economic value generated) is dominated by highly developed economies transitioning towards service-based economic structures.
- The combined Resource Efficiency/Intensity Index is led by the United Kingdom, followed by Malawi, Sweden, Denmark, and Kenya.
- Several African countries, including the Democratic Republic of the Congo, Uganda, and Benin, also rank among the top 20, highlighting their efficiency in resource use.
- Among major economies, Germany is ranked 36th, the United States 93rd, and Japan 109th.
- China ranks 108th, primarily due to its reliance on heavy industries and extensive construction activities, coupled with relatively low resource efficiency. However, while resource intensity in China is increasing, there are indications of improvements in overall efficiency.
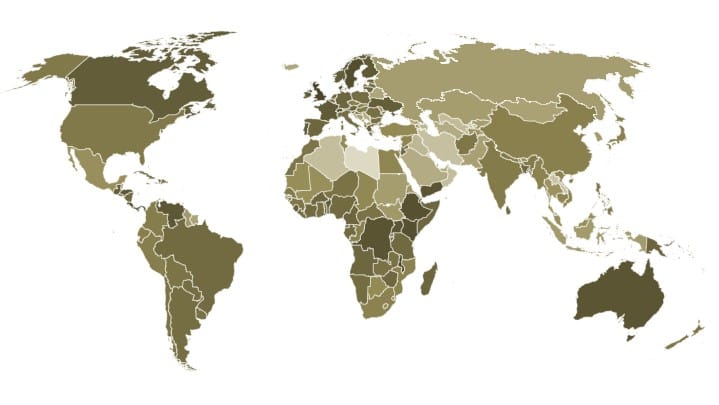
The Resource Intensity World Map:

Resource Intensity Ranking 2024
| Country | Rank | Score |
|---|---|---|
| United Kingdom | 1 | 59.65 |
| Malawi | 2 | 58.86 |
| Sweden | 3 | 57.51 |
| Denmark | 4 | 56.93 |
| Kenya | 5 | 56.85 |
| Ethiopia | 6 | 56.76 |
| Costa Rica | 7 | 56.54 |
| Djibouti | 8 | 56.53 |
| Congo DR | 9 | 55.85 |
| Australia | 10 | 55.72 |
| Switzerland | 11 | 55.66 |
| Yemen | 12 | 55.63 |
| Uganda | 13 | 55.47 |
| Luxembourg | 14 | 55.42 |
| Haiti | 15 | 55.20 |
| Venezuela | 16 | 55.12 |
| Honduras | 17 | 54.87 |
| Finland | 18 | 54.69 |
| Ireland | 19 | 54.49 |
| France | 20 | 54.47 |
| El Salvador | 21 | 54.33 |
| Portugal | 22 | 54.18 |
| Benin | 23 | 53.93 |
| Ukraine | 24 | 53.80 |
| Norway | 25 | 53.74 |
| Panama | 26 | 53.71 |
| Canada | 27 | 53.66 |
| Rwanda | 28 | 53.58 |
| Greece | 29 | 53.26 |
| Guatemala | 30 | 53.22 |
| Sierra Leone | 31 | 53.03 |
| Papua New Guinea | 32 | 52.08 |
| Cameroon | 33 | 52.07 |
| Lithuania | 34 | 51.77 |
| Austria | 35 | 51.74 |
| Germany | 36 | 51.71 |
| Madagascar | 37 | 51.70 |
| Burkina Faso | 38 | 51.55 |
| Somalia | 39 | 51.53 |
| Angola | 40 | 51.50 |
| Spain | 41 | 51.42 |
| Estonia | 42 | 51.38 |
| Netherlands | 43 | 51.22 |
| Zimbabwe | 44 | 51.19 |
| Bangladesh | 45 | 50.85 |
| Tanzania | 46 | 50.68 |
| Palestine, State of | 47 | 50.59 |
| Brazil | 48 | 50.52 |
| Côte d'Ivoire | 49 | 50.47 |
| Nicaragua | 50 | 50.46 |
| Jordan | 51 | 50.43 |
| Nigeria | 52 | 50.36 |
| Gabon | 53 | 50.36 |
| Sri Lanka | 54 | 49.93 |
| Namibia | 55 | 49.77 |
| Fiji | 56 | 49.75 |
| Poland | 57 | 49.74 |
| Solomon Islands | 58 | 49.66 |
| Paraguay | 59 | 49.62 |
| Italy | 60 | 49.60 |
| Belgium | 61 | 49.51 |
| Liberia | 62 | 49.48 |
| Argentina | 63 | 49.43 |
| Ghana | 64 | 49.37 |
| Cuba | 65 | 49.15 |
| Romania | 66 | 49.10 |
| Latvia | 67 | 48.94 |
| Bulgaria | 68 | 48.87 |
| Uruguay | 69 | 48.83 |
| Vanuatu | 70 | 48.62 |
| Zambia | 71 | 48.62 |
| Cyprus | 72 | 48.60 |
| Sao Tome and Principe | 73 | 48.52 |
| Chile | 74 | 48.46 |
| Central African Republic | 75 | 48.44 |
| Niger | 76 | 48.34 |
| Jamaica | 77 | 48.24 |
| Bolivia | 78 | 48.21 |
| Burundi | 79 | 48.15 |
| Equatorial Guinea | 80 | 48.11 |
| Morocco | 81 | 47.94 |
| Gambia | 82 | 47.42 |
| Dominican Republic | 83 | 47.36 |
| Guinea | 84 | 47.27 |
| Timor-Leste | 85 | 47.26 |
| Afghanistan | 86 | 47.25 |
| New Zealand | 87 | 47.25 |
| Saint Vincent and the Grenadines | 88 | 47.17 |
| Slovakia | 89 | 47.17 |
| Philippines | 90 | 47.17 |
| Croatia | 91 | 46.93 |
| Togo | 92 | 46.93 |
| United States of America | 93 | 46.70 |
| Israel | 94 | 46.56 |
| Nepal | 95 | 46.45 |
| Senegal | 96 | 46.35 |
| India | 97 | 46.22 |
| Hungary | 98 | 46.18 |
| Malta | 99 | 46.03 |
| Colombia | 100 | 45.84 |
| Guinea-Bissau | 101 | 45.80 |
| Czechia | 102 | 45.67 |
| Ecuador | 103 | 45.66 |
| Slovenia | 104 | 45.65 |
| Peru | 105 | 45.64 |
| Congo | 106 | 45.43 |
| Kiribati | 107 | 45.20 |
| China | 108 | 45.04 |
| Japan | 109 | 44.95 |
| Liechtenstein | 110 | 44.63 |
| Mozambique | 111 | 44.56 |
| South Africa | 112 | 44.55 |
| Myanmar | 113 | 44.48 |
| Comoros | 114 | 44.30 |
| Cambodia | 115 | 44.06 |
| Viet Nam | 116 | 43.98 |
| Maldives | 117 | 43.92 |
| Lesotho | 118 | 43.88 |
| Syrian Arab Republic | 119 | 43.84 |
| Albania | 120 | 43.64 |
| Egypt | 121 | 43.48 |
| Grenada | 122 | 43.37 |
| Dominica | 123 | 43.25 |
| Chad | 124 | 43.04 |
| Turkey | 125 | 42.70 |
| Barbados | 126 | 42.54 |
| Botswana | 127 | 42.54 |
| Trinidad and Tobago | 128 | 42.53 |
| Bhutan | 129 | 42.31 |
| Tunisia | 130 | 42.19 |
| Belize | 131 | 42.01 |
| Mauritania | 132 | 41.92 |
| Malaysia | 133 | 41.82 |
| Moldova | 134 | 41.63 |
| Andorra | 135 | 41.63 |
| Eswatini | 136 | 41.61 |
| Mali | 137 | 41.55 |
| Mexico | 138 | 41.42 |
| Thailand | 139 | 40.96 |
| Antigua and Barbuda | 140 | 40.50 |
| Tajikistan | 141 | 40.49 |
| Brunei Darussalam | 142 | 40.37 |
| Eritrea | 143 | 40.05 |
| South Sudan | 144 | 39.54 |
| Cabo Verde | 145 | 39.53 |
| Samoa | 146 | 39.36 |
| Guyana | 147 | 39.31 |
| Korea | 148 | 39.19 |
| Saint Lucia | 149 | 39.17 |
| Armenia | 150 | 39.17 |
| Indonesia | 151 | 39.00 |
| Bahamas | 152 | 38.95 |
| Sudan | 153 | 38.55 |
| Kyrgyzstan | 154 | 38.54 |
| Russian Federation | 155 | 38.42 |
| Kazakhstan | 156 | 38.42 |
| Bosnia and Herzegovina | 157 | 38.36 |
| Montenegro | 158 | 38.28 |
| Pakistan | 159 | 37.93 |
| Singapore | 160 | 37.88 |
| Tonga | 161 | 37.86 |
| Tuvalu | 162 | 37.83 |
| Seychelles | 163 | 37.80 |
| North Macedonia | 164 | 37.53 |
| Mongolia | 165 | 37.47 |
| Suriname | 166 | 36.97 |
| Belarus | 167 | 36.67 |
| Iceland | 168 | 36.46 |
| Mauritius | 169 | 36.32 |
| Georgia | 170 | 36.27 |
| Qatar | 171 | 36.16 |
| Turkmenistan | 172 | 35.42 |
| Saudi Arabia | 173 | 35.42 |
| Serbia | 174 | 35.09 |
| United Arab Emirates | 175 | 34.99 |
| Kuwait | 176 | 34.67 |
| Saint Kitts and Nevis | 177 | 34.66 |
| Lebanon | 178 | 33.09 |
| Azerbaijan | 179 | 33.06 |
| Iraq | 180 | 32.86 |
| Micronesia | 181 | 32.75 |
| Bahrain | 182 | 32.66 |
| Uzbekistan | 183 | 32.14 |
| Oman | 184 | 31.70 |
| Algeria | 185 | 31.41 |
| Iran | 186 | 30.89 |
| Lao | 187 | 30.45 |
| Marshall Islands | 188 | 29.89 |
| Palau | 189 | 29.86 |
| Kosovo | 190 | 29.71 |
| Libya | 191 | 25.58 |

Download the data: [download id="11713"](XLSX)](https://solability.com/wp-content/uploads/2024/12/GSCI-2024-Cover-1.jpg)
![Sustainable_Competitive Report Achieving Sustainable Competitiveness: policies for more sustainable AND more prosperous societies:[download id="3496"]](https://solability.com/wp-content/uploads/2021/01/Sustainable_Competitive-Report.jpg)