
Sustainable
Competitiveness
Proud publisher of the Global Sustainable Competitiveness Index.
Architects of 3 DJSI World Leaders.
Independent research & analytics.
Challenges are opportunities.
Data-driven ESG for better performance.
The Global Sustainable
Competitiveness Index
The world's most comprehensive measurement framework to assess and compare sustainable competitiveness — and the State of the World.
For Evidence-based Policy Decisions
A critical system for evidence-based policy decisions and strategic planning at the national level.
Global ESG Benchmarking
Compare performance across 193 countries with 50+ years of comprehensive historical data.
Professional Risk Management Dashboard
ESG country risk intelligence for businesses, investors, and financial institutions
Sustainable Competitiveness Leadership
Integrating ESG Strategy, Management, and Communication.
With the architects of 3 DJSI World Industry Leaders.
Research & Publications
Thought leadership and data-driven insights on sustainable competitiveness and global trends.
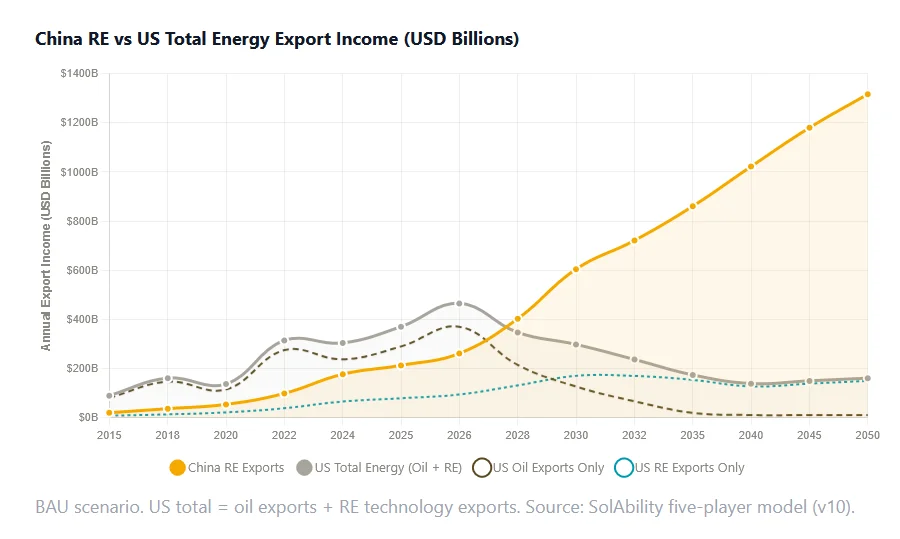
Drill Baby Drill vs Electrification: The US-China Energy Competitiveness Gap
GSCI data reveals a widening competitiveness gap between the US and China in renewable energy manufacturing. China overtook the US in high-tech manufacturing in 2015 and overall competitiveness in 2022, and now leads by widening margins across every industrial indicator.
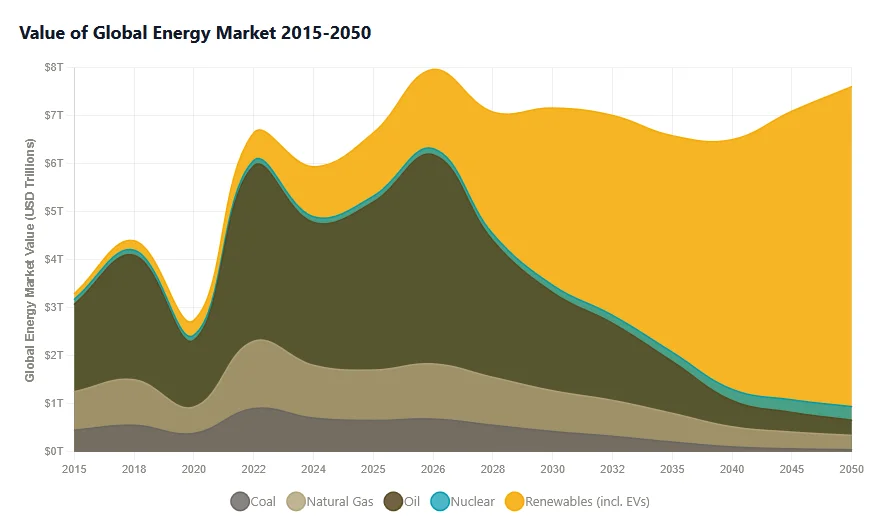
The Global Energy Market Outlook: From Fossil Fuels to a $6-8 Trillion Renewable Economy
The $6-8 trillion global energy market is undergoing structural transformation. Renewable energy costs have collapsed; fossil fuels are becoming uncompetitive. This is the story of winners, losers, and the economic shift defining the next half-century.
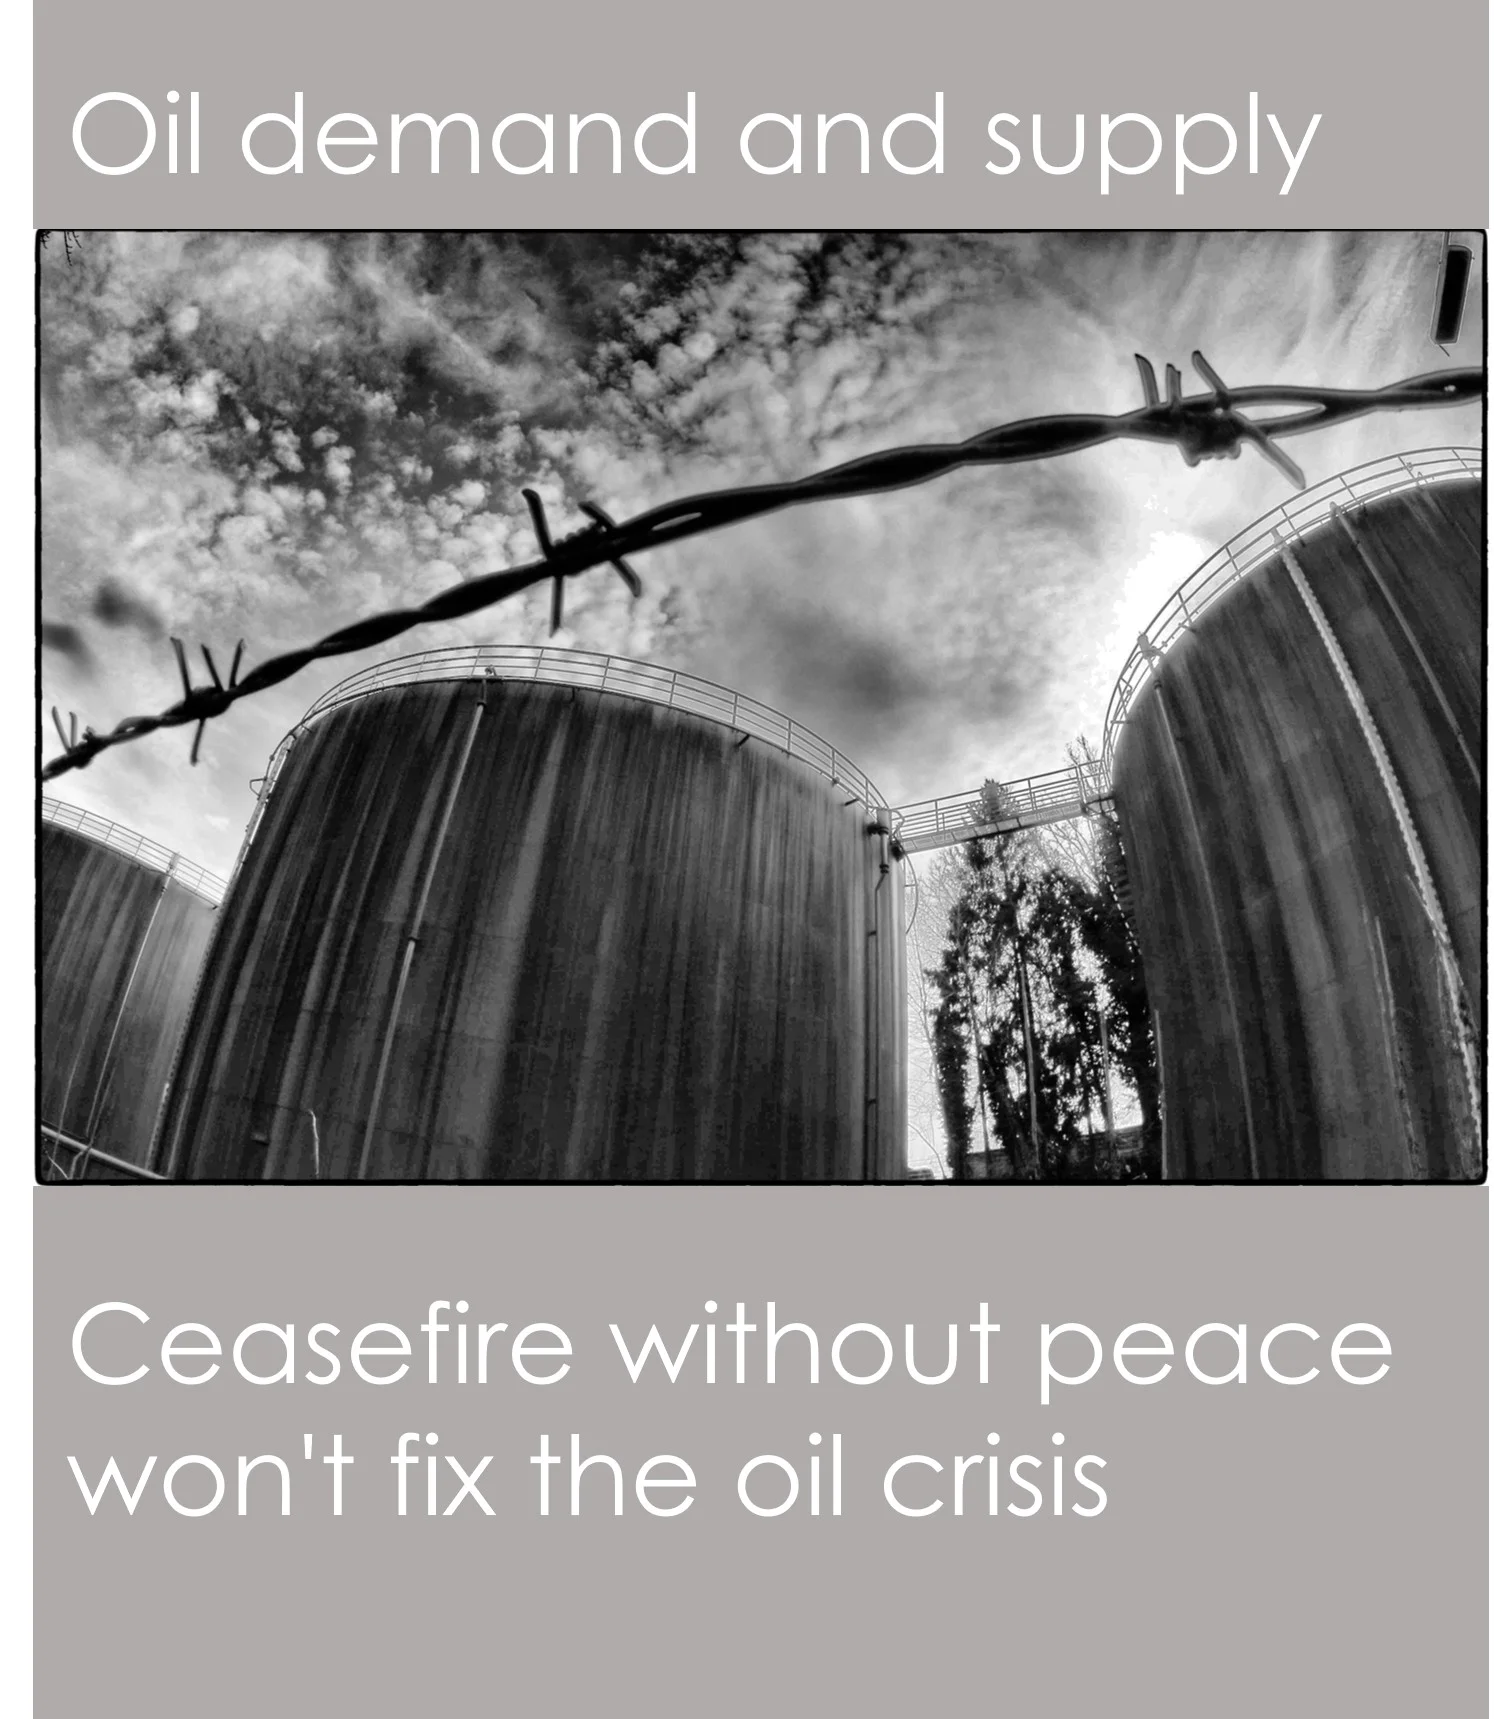
Why a ceasefire won't fix the oil crisis: supply, demand, and the phantom ceasefire problem
Global oil inventories were at a five-year high when the war started. Seven weeks later, they're draining at 200 million barrels per month. Analysis of supply recovery lags, the phantom ceasefire scenario, refined product shortfalls, and what consumers actually pay.
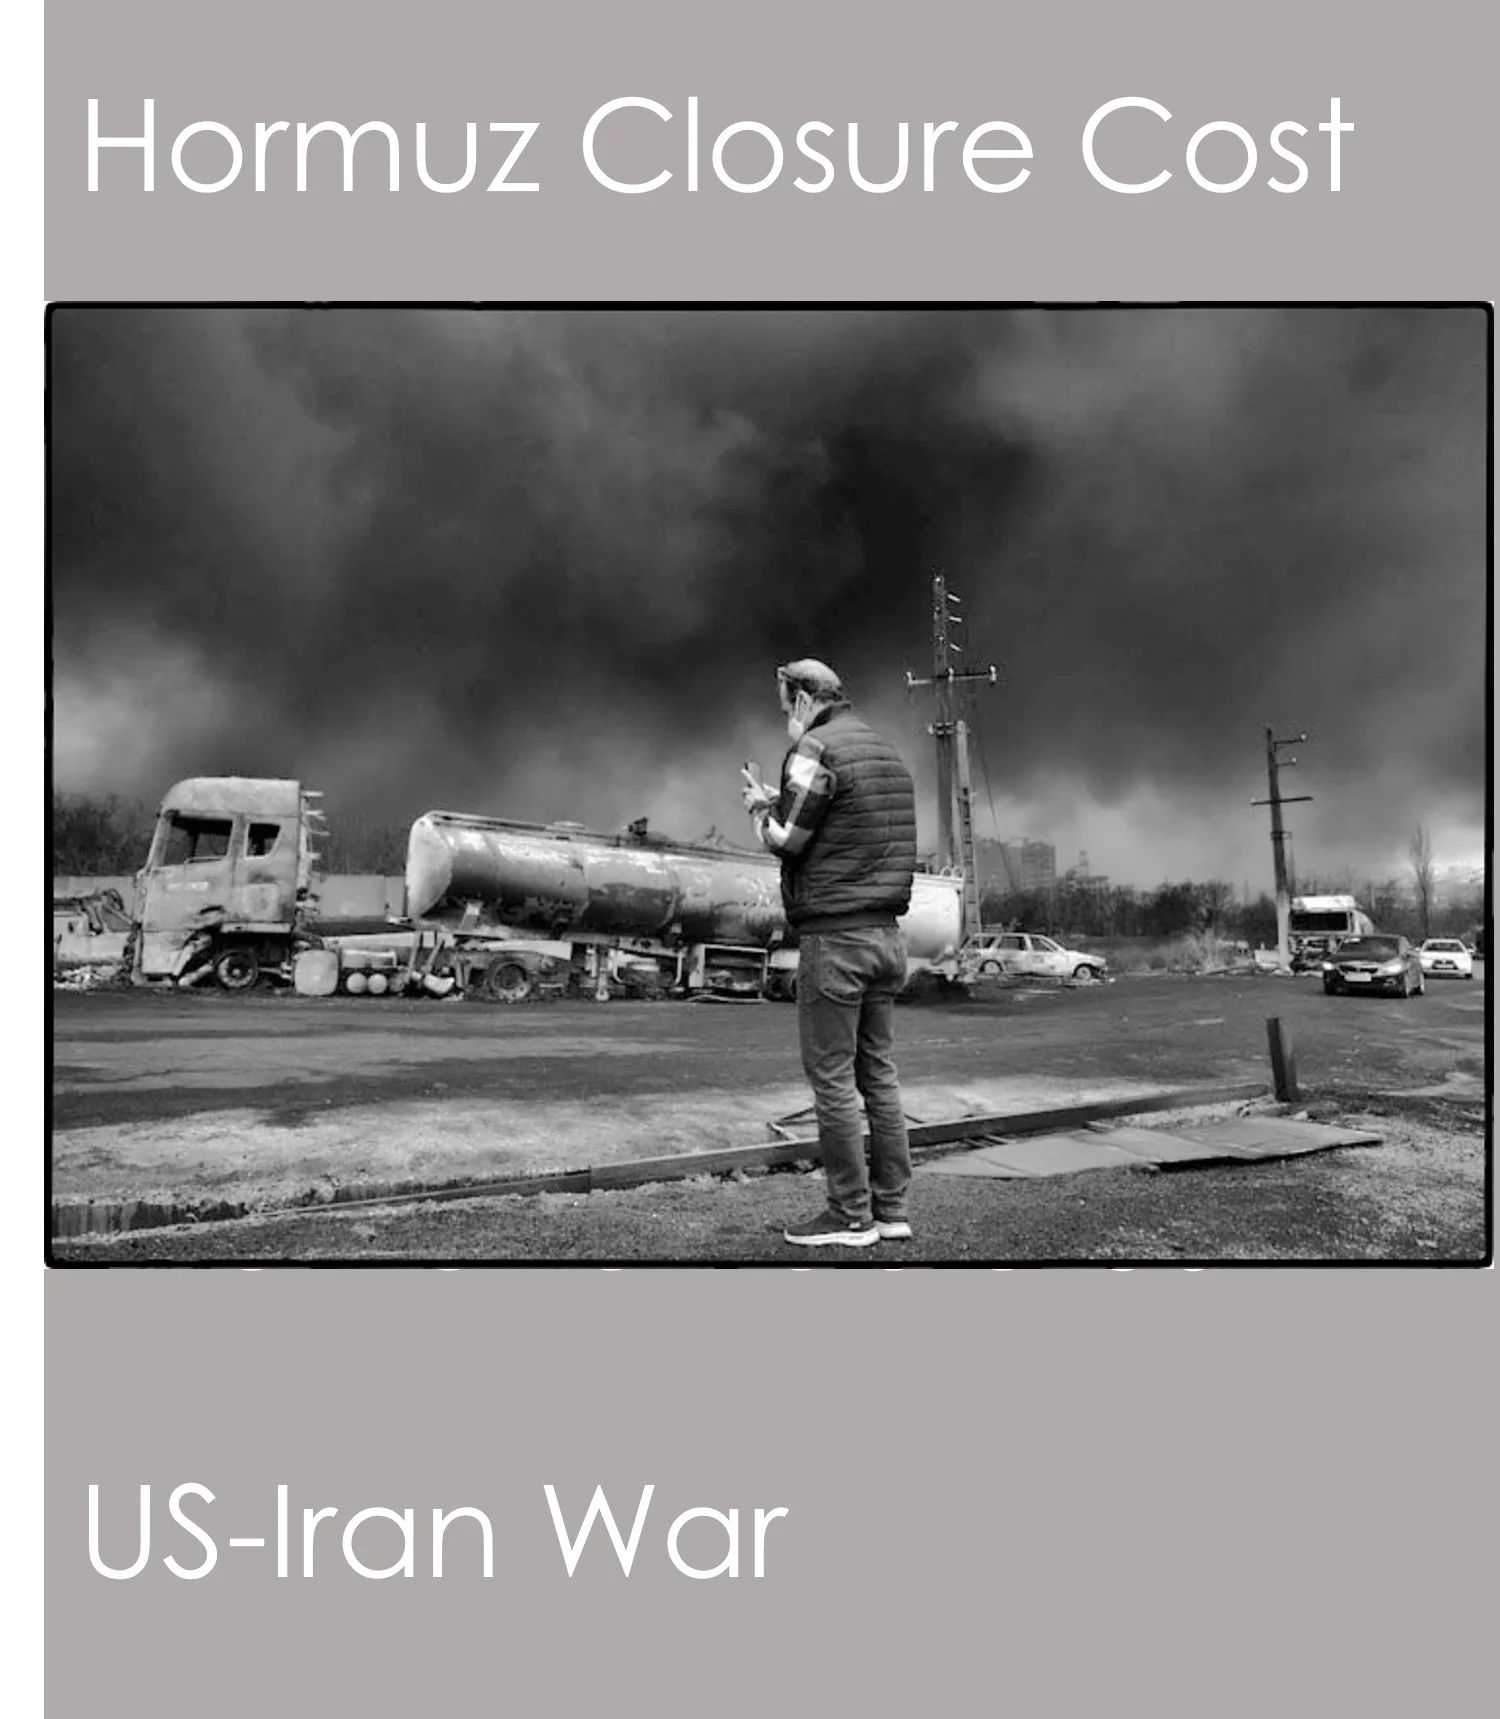
Gulf Crisis 2026: The Daily Cost of the Closure of the Strait of Hormuz
Day-by-day economic model of the Strait of Hormuz closure. Three scenarios, four channels, 87 countries. Brent crude, cumulative GDP loss, inflation and oil price trajectories from Day 0 to Day 180. Interactive calculator lets you set the scenario and conflict duration.
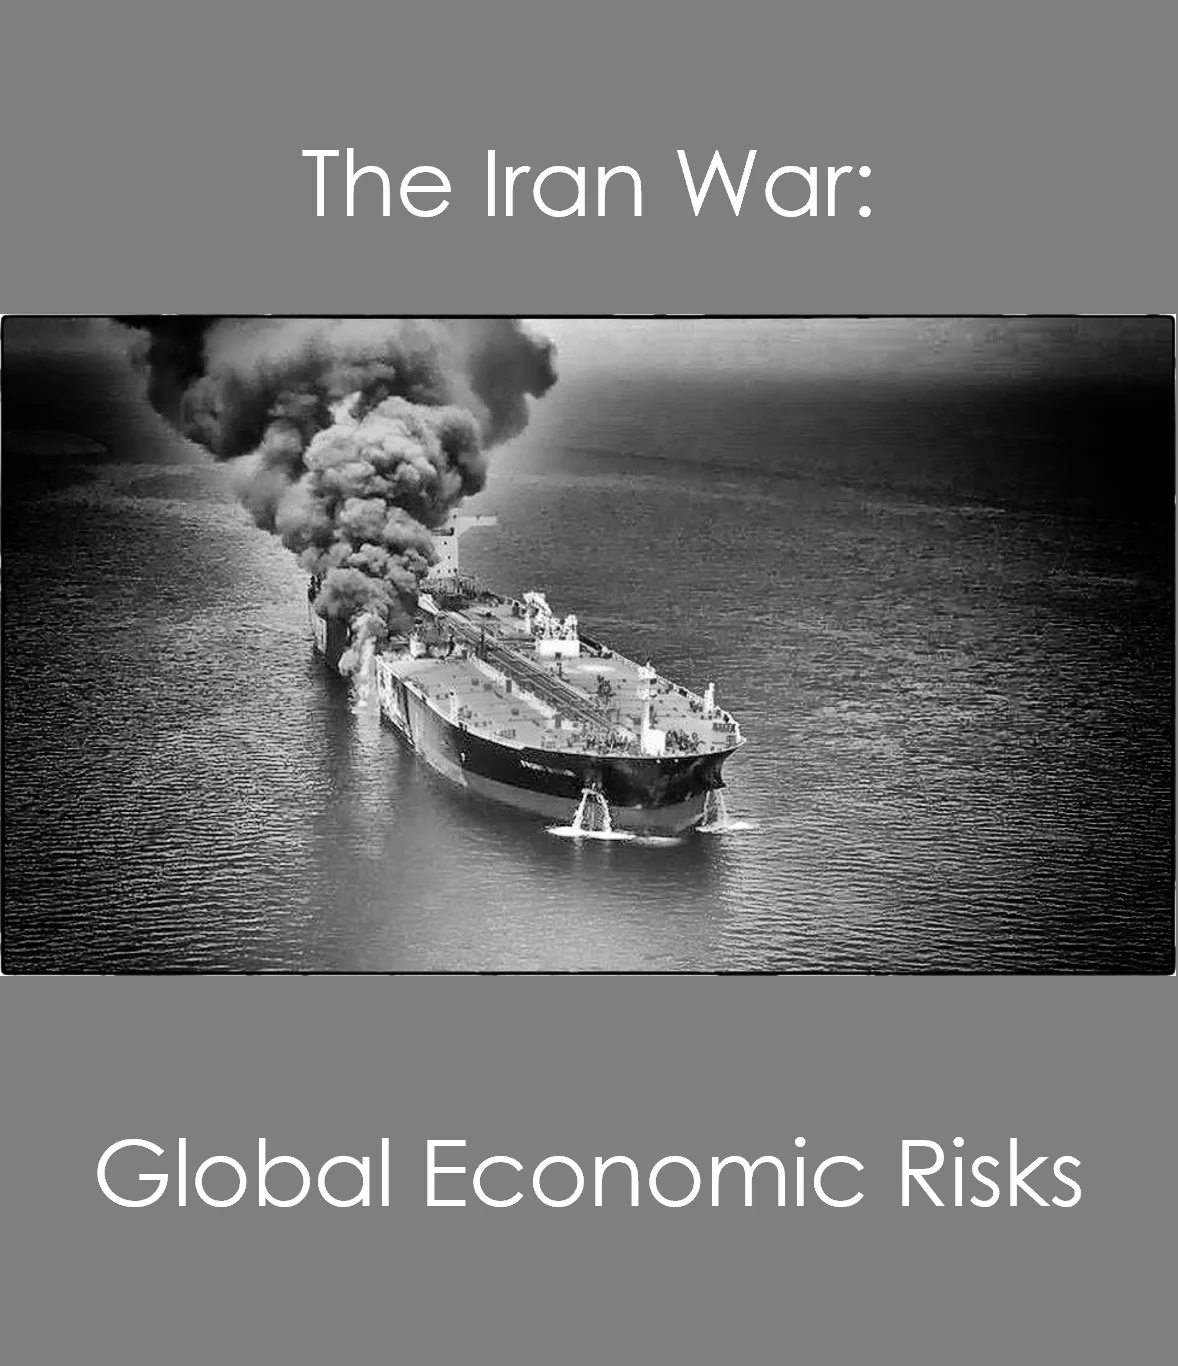
The Iran War: Implications for the Global Economy
The effective closure of the Strait of Hormuz has stranded 15.8M bpd across GCC states and Iraq. Three scenarios model the transmission to global GDP — from −$590B to −$3.5T (3.15% of world GDP) — across oil, LNG, fertilizer and shipping channels. Gulf states and Iraq are net losers in all of them.
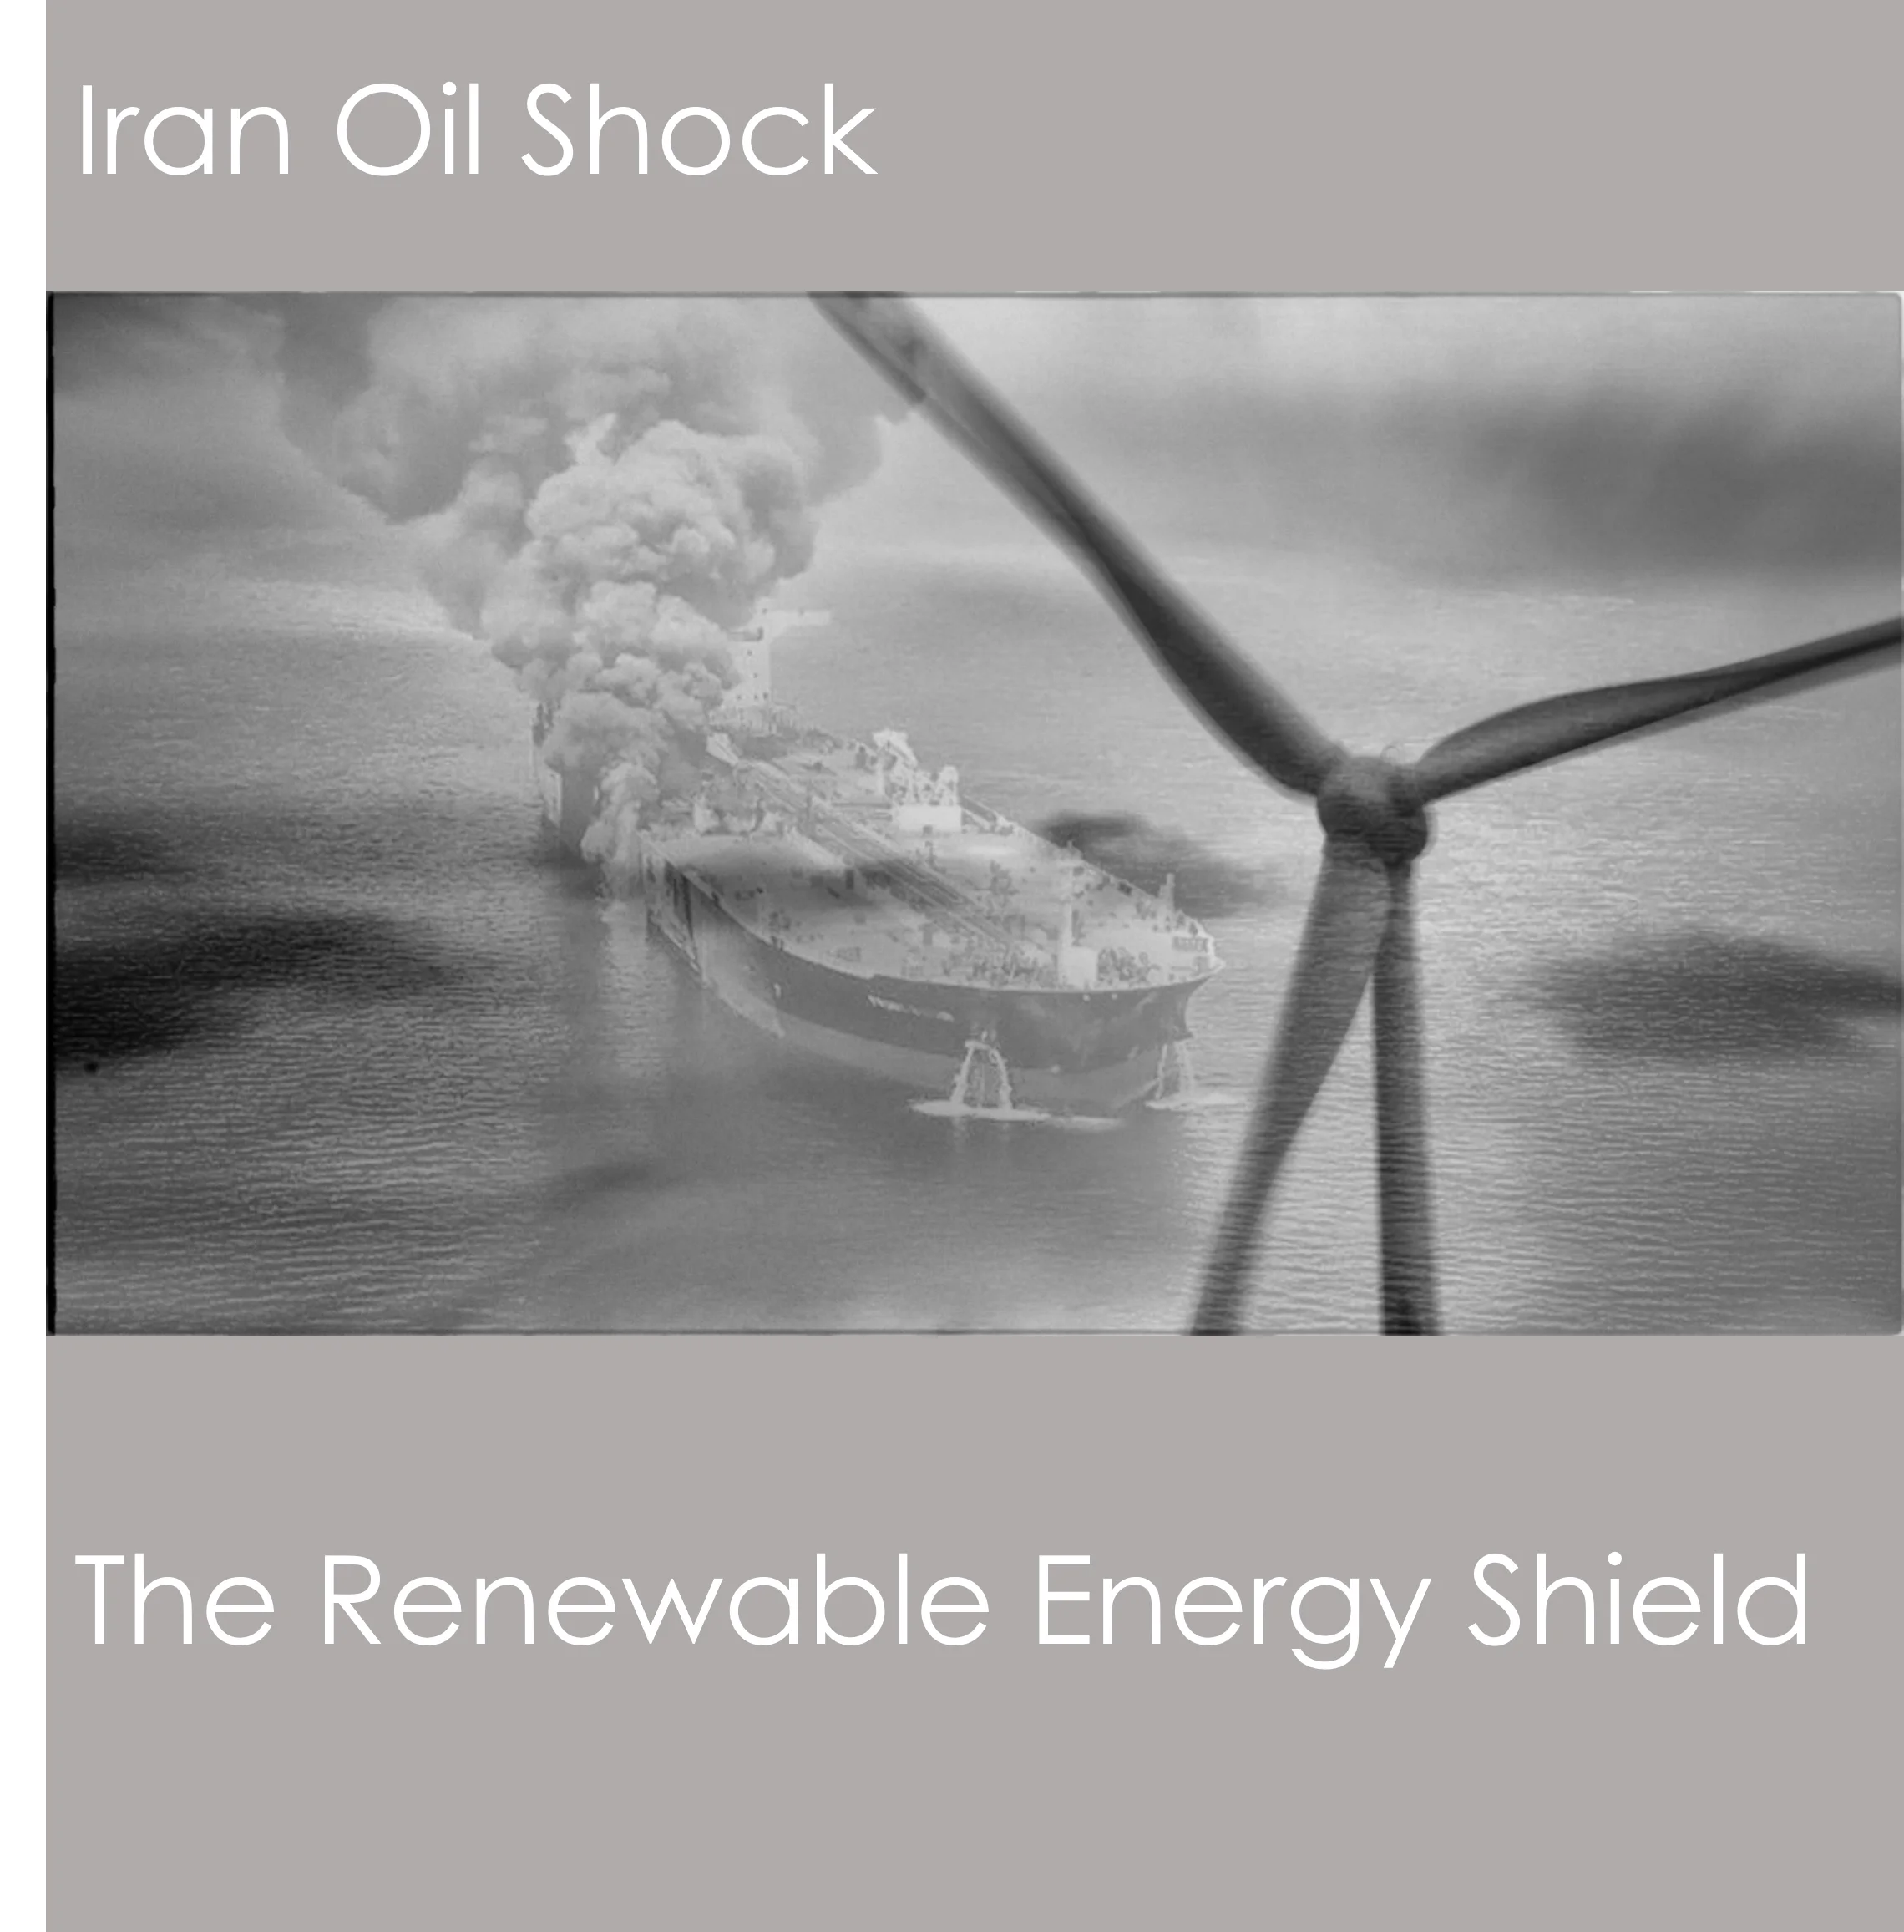
Iran Oil Price Shock: The Renewable Energy Shield
How a country's energy mix determines its vulnerability to the Gulf crisis. Renewable electricity buffers 6–29% of total energy exposure across 34 countries. Uruguay's 98% RE grid saves 0.15pp on the electricity channel; China's LNG trap makes it more exposed than 20 years ago. Global GDP at risk: −3.15% in the prolonged scenario.
ESG News by 3BL
Latest sustainability updates